
In the cryptocurrency market, understanding volatility is essential for making good decisions. Prices can move sharply and suddenly, and recognizing those moments in advance can make all the difference.
That’s where Bollinger Bands come in a technical indicator that helps visualize when the market is too “quiet” and about to move, or when it’s stretched and may be due for a correction.
Simple to use and extremely effective, this indicator is a favorite among both beginner and experienced traders. In this post, you’ll learn how it works and how to apply it to crypto charts.
What Are Bollinger Bands?
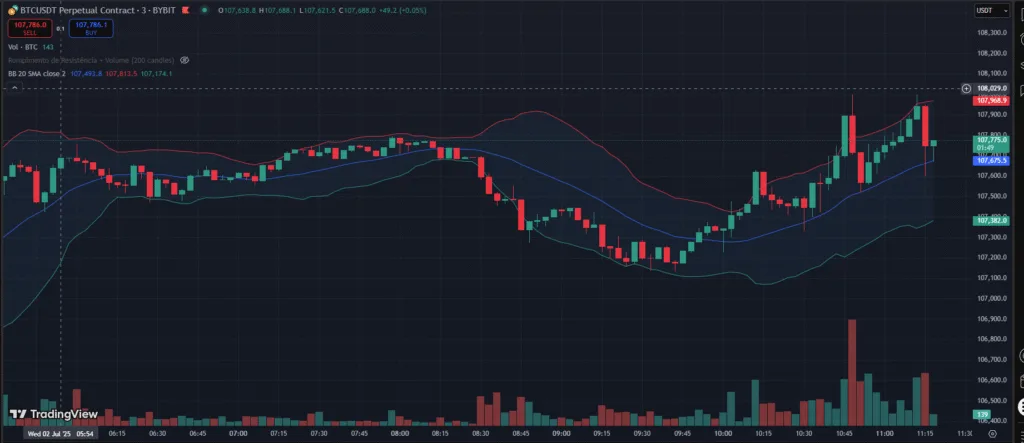
Bollinger Bands are a technical indicator created by John Bollinger in the 1980s. They consist of three lines plotted directly on the price chart:
- A simple moving average (usually 20 periods) in the center,
- An upper band, placed a few standard deviations above the average,
- A lower band, placed the same number of standard deviations below the average.
The main purpose of the bands is to show how far the price is moving away from the average in other words, the asset’s volatility.
When the bands move farther apart, it means the market is more volatile. When they contract and move closer together, it indicates low volatility and that a strong price movement might be approaching.
How Bollinger Bands Work
Bollinger Bands respond directly to market volatility. When price fluctuations increase, the bands widen. When the market consolidates, the bands contract. This visual behavior helps traders identify potential entry and exit points.
Here’s how to interpret them:
- Narrow Bands (Squeeze): indicate low volatility. This often comes before a strong move, but the indicator doesn’t reveal the direction.
- Price touching the upper band: can signal the asset is overbought. However, it’s not a confirmation to sell just a warning.
- Price touching the lower band: may suggest oversold conditions, but it’s not an automatic buy signal either.
- Walking the band: during strong trends, price can “ride” the upper or lower band for an extended period without an immediate correction.
Bollinger Bands don’t predict direction, but they show market conditions that help you prepare for what may come next.
Key Signals Traders Look For with Bollinger Bands
Bollinger Bands are popular because they make it easier to spot moments when the market may be overextended. One of the most closely watched signals is the so-called squeeze, which happens when the bands contract. This indicates a period of low volatility and often comes just before a stronger move although the indicator alone doesn’t reveal which direction the price will take. That’s why many traders treat the squeeze as an early warning, waiting for confirmation through volume or another indicator before taking action.
Another common pattern is when the price touches or moves beyond one of the bands. If it happens at the upper band, it can suggest the asset is overbought. The same goes for the lower band, which may signal an oversold condition. Still, these touches shouldn’t be taken as automatic reversal signals the market can continue moving in the same direction, especially during strong trends.
Because of that, Bollinger Bands are often combined with other tools like the RSI, MACD, or even volume analysis. This helps traders better understand the context and avoid making decisions based solely on a single band interaction.
How to Use Bollinger Bands with Cryptocurrencies
In the crypto market, where price movements are often fast and unpredictable, Bollinger Bands can be a powerful visual tool for understanding price momentum. For example, during sideways periods when Bitcoin or an altcoin is consolidating within a range the narrowing of the bands may indicate that the market is preparing for a breakout. In these moments, watching the volume and the direction of the breakout candle can help anticipate the start of a new trend.
Another practical use is observing how price behaves near the bands. If it touches the lower band and then forms a reversal candle with increasing volume, this could suggest that buyers are stepping in. The same applies to the upper band during a potential exhaustion move to the upside. However, it’s important to remember that in strong trends, price can “walk the band” for some time without correcting, so interpreting this correctly requires attention to context.
In crypto, where price behavior tends to be more volatile than in traditional markets, combining Bollinger Bands with support and resistance levels, as well as sentiment analysis (like liquidations and funding rates), can significantly improve decision making.
Conclusion
Bollinger Bands are a simple yet highly effective tool for visualizing market volatility and identifying potential entry or exit points. In the world of cryptocurrencies, where price movements can be extreme and fast, this type of insight becomes even more valuable.
They are not meant to be used as a standalone signal system, but rather as part of a broader technical analysis. When combined with other indicators and solid risk management, they can help you avoid impulsive entries and take better advantage of market imbalances.
Whether you’re just starting out or already have experience, it’s worth adding Bollinger Bands to your technical toolbox they make price behavior easier to interpret, especially when the market feels uncertain.