3 Essential Chart Patterns for Cryptocurrency Traders
Trading
07/04/2025
Have you ever opened a chart and felt completely lost unsure whether it was time to buy, sell, or just wait?
In the world of cryptocurrency trading, understanding chart patterns can be the difference between a profitable trade and a painful loss. These patterns help predict market behavior based on price action without relying on guesses or gut feelings.
In this article, you’ll discover 3 of the most important chart patterns every trader should know, especially if you trade Bitcoin, Ethereum, or other altcoins. These are simple yet powerful formations, used daily by professional traders around the world.
👉 Want to improve your entries, exits, and spot real opportunities on the chart? Then this post is for you.
First Pattern: Symmetrical Triangle
What is it?
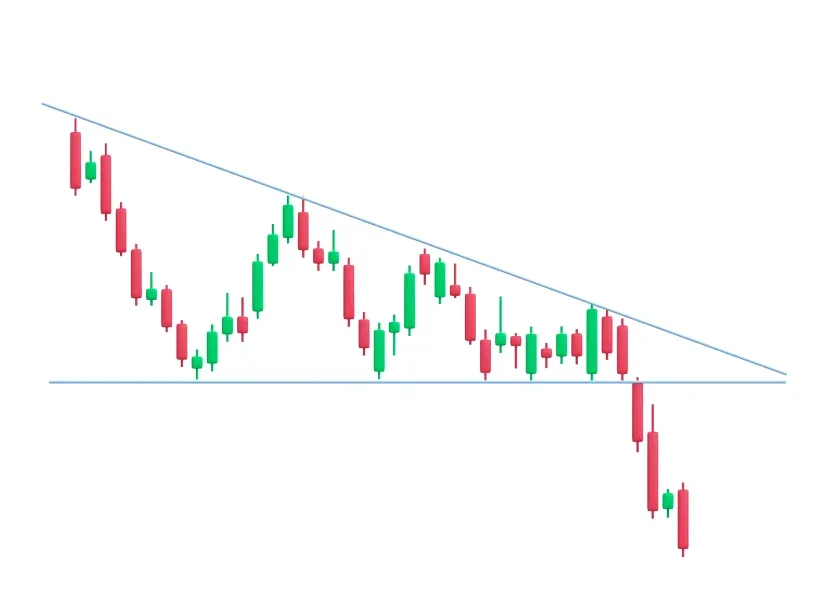
The Symmetrical Triangle is a consolidation pattern that forms when the market is in a state of indecision. It occurs as highs become lower and lows become higher, creating a “funnel” shape on the chart.
This pattern shows that buyers and sellers are balancing out, compressing the price into a tighter range until a breakout occurs in one direction.
How to interpret it
Although it looks neutral, the symmetrical triangle often precedes a strong move. The direction of the breakout (up or down) usually follows the prior trend, but it’s crucial to wait for confirmation specifically, a clean break of the triangle’s boundary.
Breakout with high volume = stronger signal.
Second Pattern: Head and Shoulders (H&S)
What is it?
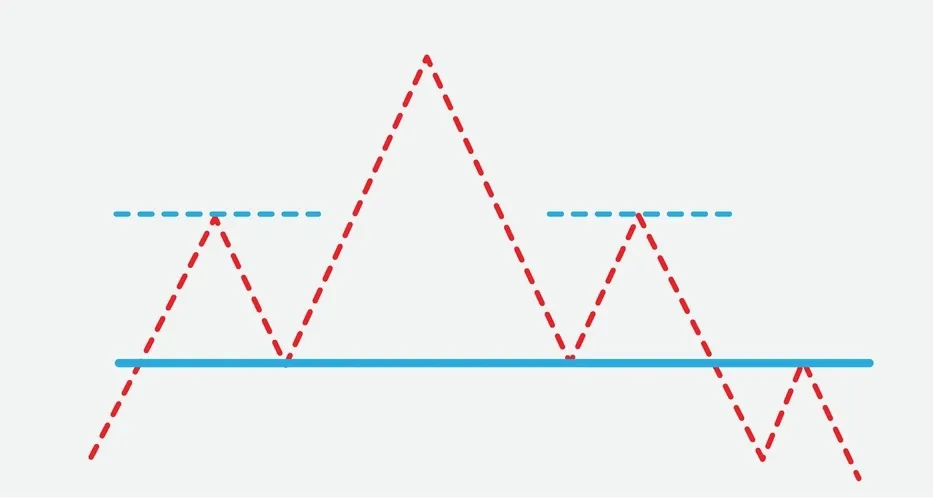
The Head and Shoulders (H&S) pattern is a classic trend reversal formation. It signals that a bullish trend is losing momentum and that a potential downtrend may be on the way.
Visually, it consists of three peaks:
A left shoulder (lower high)
A head (the highest peak)
A right shoulder (another lower high, usually mirroring the first)
Between these peaks, a horizontal or slightly sloped line is formed known as the neckline.
How to interpret it
When the price breaks below the neckline, the pattern is confirmed. This often marks the start of a downward trend, making it a strong signal to sell or consider short positions.
It’s one of the most reliable reversal signals in technical analysis.
Variation: Inverted Head and Shoulders
There’s also the Inverted Head and Shoulders, which appears after a downtrend. It suggests a potential reversal to the upside and works exactly the same just flipped upside down.
Third Pattern: Bull Flag
What is it?
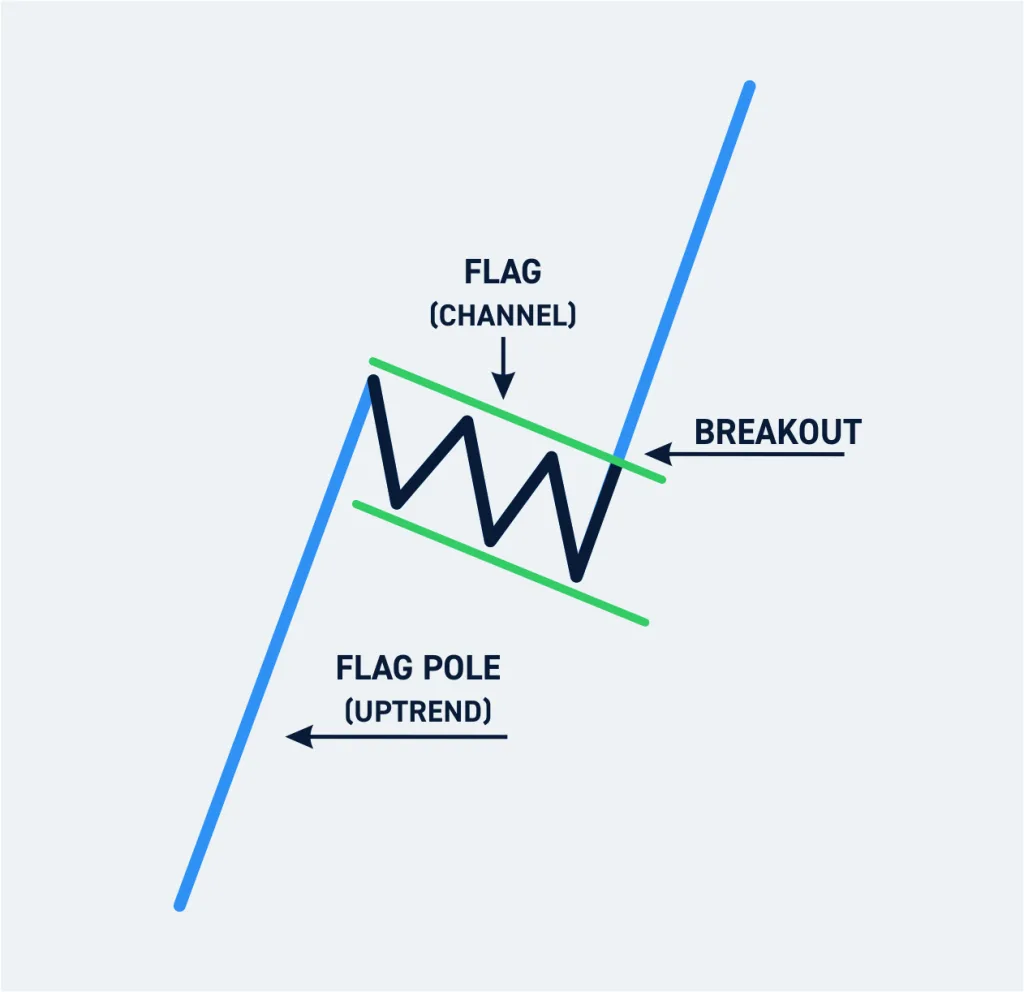
The Bull Flag is a trend continuation pattern. It appears after a strong upward move (called the flagpole), followed by a brief consolidation period with a slight downward or sideways slope forming the “flag.”
This pattern suggests that the market is simply taking a breath before continuing its upward movement.
How to interpret it
The price rallies sharply, then enters a short, controlled pullback (the flag), and finally breaks out to the upside, continuing the overall uptrend.
This breakout often provides great entry opportunities especially for day traders and swing traders looking to ride the momentum.
Key characteristics:
A well-defined uptrend leading into the pattern.
A short, downward-sloping consolidation (the flag).
A breakout with increasing volume = strong entry signal.
The stronger the flagpole, the greater the potential for the next move after the breakout.
Conclusion: Learn to Read the Chart Like a Pro
Mastering chart pattern analysis is like learning to understand the market’s language.
The three patterns you’ve explored here Symmetrical Triangle, Head and Shoulders, and Bull Flag are considered classics for a reason: they work. When used correctly, they can significantly increase your chances of success and give you more confidence in your trading decisions.
But remember: chart patterns are not guarantees. Always combine them with other tools like volume, support and resistance levels, and solid risk management.
Reading a chart isn’t about predicting the future it’s about identifying probabilities.
I've been in the cryptocurrency market since 2018, specializing in automated trading and airdrop strategies. My work focuses on turning complex opportunities into practical solutions for those looking to grow in this space intelligently and consistently.