
You don’t need to overcomplicate things to make money trading.
In fact, one of the biggest traps for beginners is thinking that the more indicators you have on the screen, the better. I’ve been there I used to fill my chart with RSI, MACD, Bollinger Bands, Ichimoku… and whatever else I could find.
And you know what happened? Nothing. Just confusion.
That’s when I decided to simplify.
Today, I want to show you two setups that I actually use and that, over time, have helped me build consistency in my results. They’re simple, but they work.
And most importantly: you’ll understand why they work.
Oh, and if you’re just getting started don’t worry. I’ll explain everything clearly, including the technical terms, and walk you through step by step how to spot these setups on a chart.
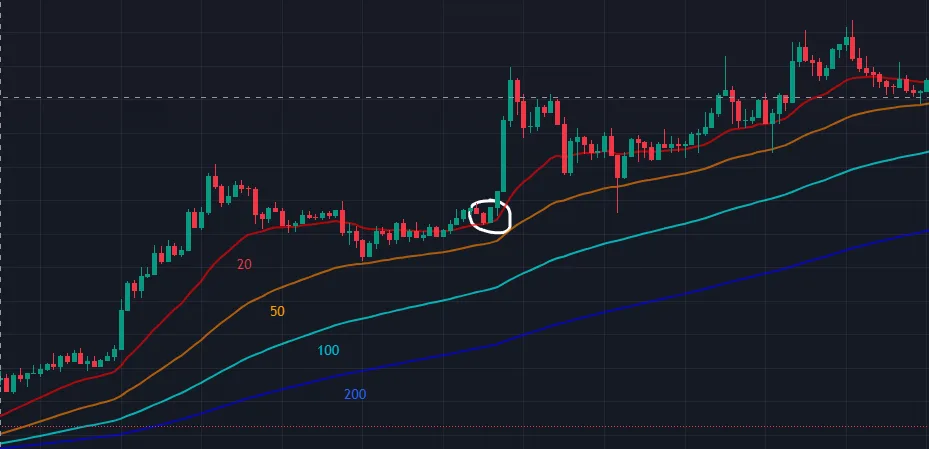
Setup 1: Pullback to the 20 EMA with Confluence of EMAs
This is one of the setups I respect the most. It combines simplicity with precision and when used properly, it offers high-probability entry points.
🧠 Why does it work?
The 20 period EMA (Exponential Moving Average) is great for identifying short term momentum. But what really strengthens the setup is the confluence with other EMAs: the 50, 100, and 200.
When the price pulls back and touches more than one of these EMAs in the same area (or nearby), it’s like multiple “floors” of market support holding the price and that significantly increases the chances of a bounce.
🛠️ What I look for before entering:
- A clear uptrend, with price above the 200 EMA
- The 20, 50, 100, and 200 EMAs aligned from top to bottom (20 > 50 > 100 > 200)
- Price pulls back to the 20 EMA, with other EMAs nearby or acting as support
- A rejection candle forms at that region, showing buyer defense, with solid volume
📈 Practical example:
Imagine Ethereum is in an uptrend. It rallies hard, starts to correct, and touches the 20 EMA. At the same time, the 50 EMA is right below, and the 100 and 200 are not far off. The price hits that area, forms a strong bullish candle, and volume starts to increase.
That’s a confluence entry. Stop loss goes below the 50 EMA or the recent swing low. Target: previous resistance or a 2:1 risk/reward ratio.
⚠️ Cautions:
- Avoid trading if the EMAs are tangled that signals a sideways market.
- If price breaks through the 20 EMA with strong momentum, wait for a new structure to form.
- Confluence isn’t a guarantee, but it’s a strong indication of institutional support.
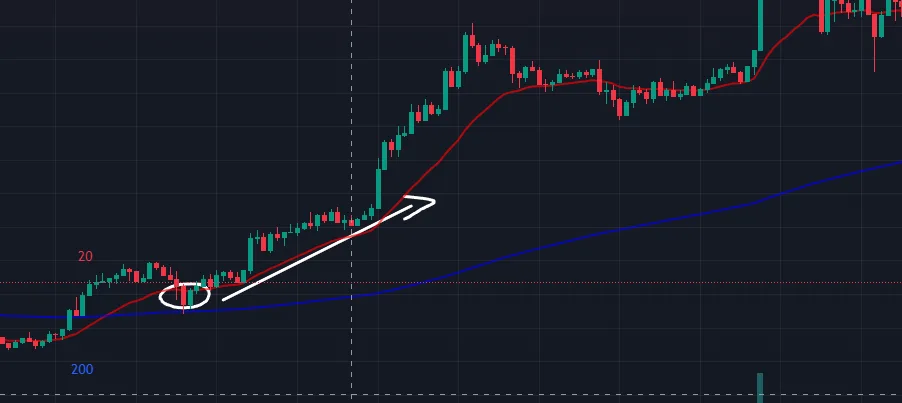
Setup 2: EMA 21 and EMA 200 Crossover
This is a classic setup and it still works very well when used with the right filters. The goal is to spot trend reversals and enter at key points on the chart.
🧠 What’s the logic behind it?
The 200 EMA is like the “foundation” of a trend widely used by institutional players to define whether an asset is in a long-term uptrend or downtrend.
The 21 EMA, on the other hand, reflects more recent price action short term movement.
When the 21 EMA crosses above the 200 EMA, it may signal the start of a new uptrend. If it crosses below, it could be the beginning of a stronger downtrend.
This crossover shows that the short-term is shifting direction and may drag the broader market with it.
⚙️ How I use this setup:
- Wait for the 21 EMA to cross the 200 EMA
- Then, wait for a pullback (a light correction) after the crossover
- If the pullback respects the 200 EMA or even the 21 EMA and a strong trend candle forms, I consider entering
- Place a tight stop just below the 200 EMA or the nearest swing low
- Target could be a previous high or at least a 2:1 risk/reward ratio
📉 Practical example:
Let’s say Bitcoin has been in a downtrend, with the 21 EMA below the 200. But recently, it starts to gain strength, and the 21 EMA crosses above the 200. That’s a signal.
After the crossover, the price pulls back lightly, touches the 200 EMA area, and prints a bullish candle with solid volume. That’s an ideal entry setup.
⚠️ Pro tips:
- Don’t jump in right at the crossover wait for the pullback. That’s what confirms the strength of the new trend
- Volume must support the move. If the market is flat or weak, stay cautious
- This setup works best on higher timeframes like 1h, 4h, or daily charts
These two setups I shared here are exactly the ones I use in my day to day trading.
They didn’t come from a book or some random YouTube video they’re strategies that bring me real, consistent results when applied with discipline.
The real secret isn’t just the setup itself, but how you execute it:
- Backtest before risking real money.
- Use solid risk management that’s what separates those who survive from those who blow up.
- And most importantly: understand why you’re entering or exiting a trade.
It’s not about always being right. It’s about having a clear method, repeating it consistently, and learning from every trade.
Over time, you can adapt these setups to your own style, combine them with indicators that make sense to you, or even automate everything with bots something I also teach here on the site.
If you liked this content, check out the other posts.
Here, I share what I actually use in the market from airdrops to automated trading.
No miracle promises, just real world practice.
See you in the next post.